Looking for a specific icon? contact us,
we create custom icons for your human-machine interface (HMI).
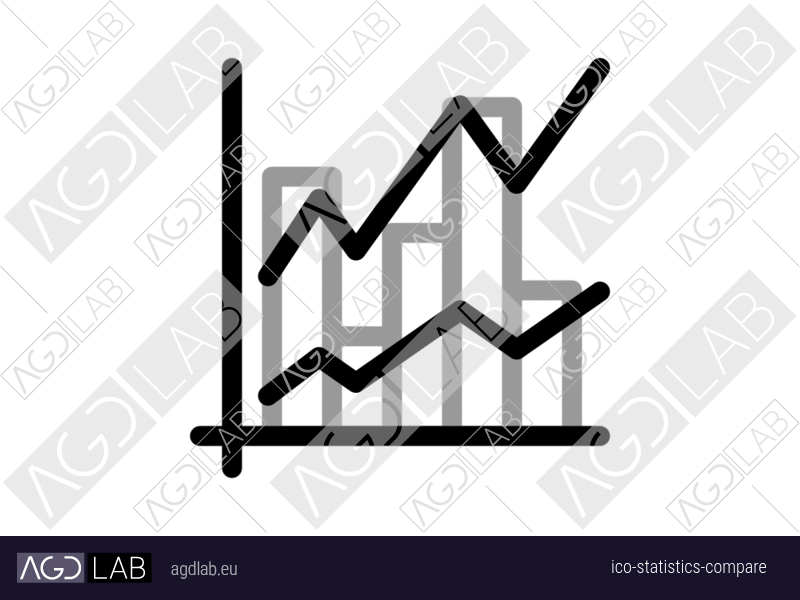
Statistics compare icon
Icon with line graph or trend chart and two related elements. Used in data analysis, real-time statistics, performance monitoring, and reporting visualization systems. Represents comparing specifications, features, or dimensions between multiple items, showing differences, or duplicate detection. Used in data analysis, real-time statistics, performance monitoring, and reporting visualization systems.
| Product Type |
|---|